Inclusive Authoring Environments
Inclusive learning content is a product of authoring tools and environments that promote the creation of content alternatives and preferences (see Metadata, Learner needs and preferences, Audio content and learning, Video content and learning). Consumers of open educational resources quickly become authors when they rework, edit, or remix existing content. It becomes critical, then, that these authoring environments both offer and gently suggest to authors the creation of layered, malleable content.
Take Away
Whenever possible, try to find an authoring tool that promotes the creation of alternatives and preferences.
Case Study 1: OER Commons Authoring Environment
Floe and ISKME collaboratively designed an open education resource authoring environment that is easy to use; is inclusive to a diversity of different users; and both offers and gently suggests authors to create layered, malleable content.
The authoring environment is sensitive to Floe’s Learner Options (see Learner needs and preferences), and morphs its authoring environment according to the author’s preferences. Figure 4 and Figure 5 show the editing environment in high contrast and with large interface elements, respectively.
Moreover, the authoring environment provides an easy way for authors to add content layers to media, such as descriptions for images (see Figure 7), and localized captions for video (see Figure 6). When the media is initially added without these layers, a gentle status icon and editing affordances indicate to authors that such layers are missing, and silently guides them to adding said layers.
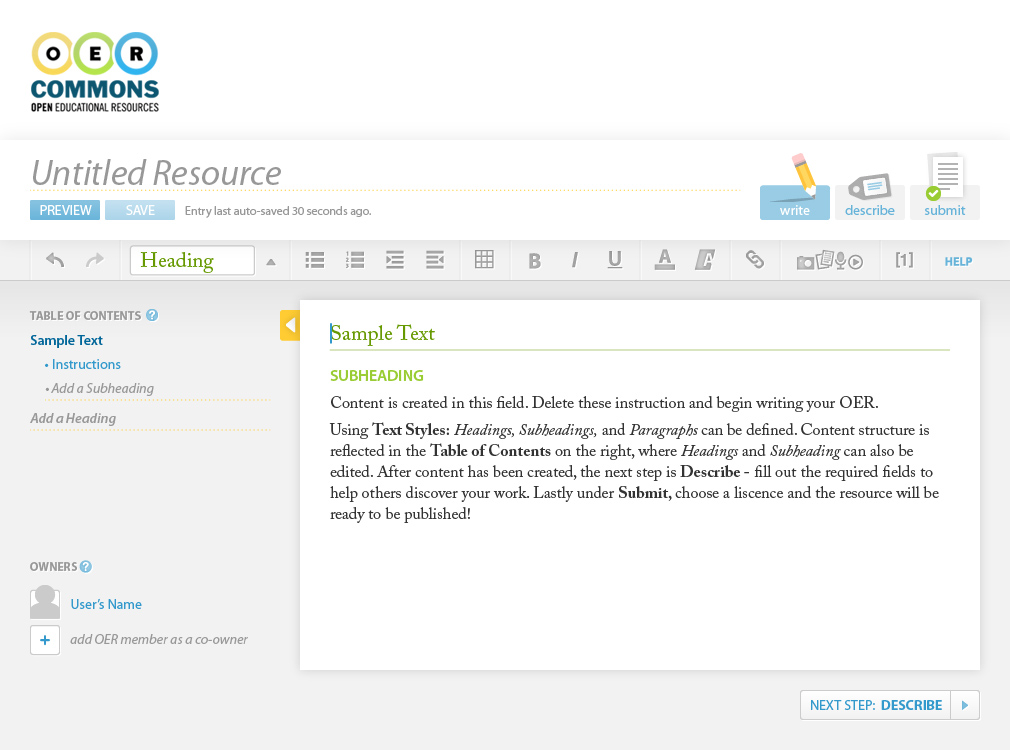
Figure 1: Floe/OER Commons authoring environment, editing screen.
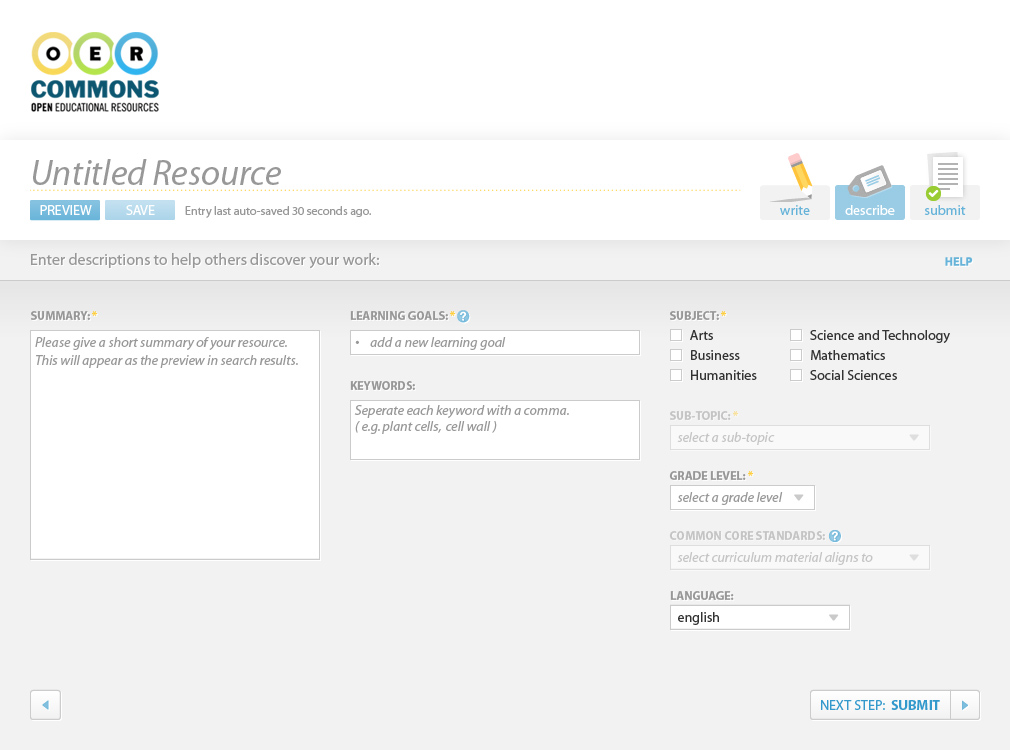
Figure 2: Floe/OER Commons authoring environment, metadata input screen.
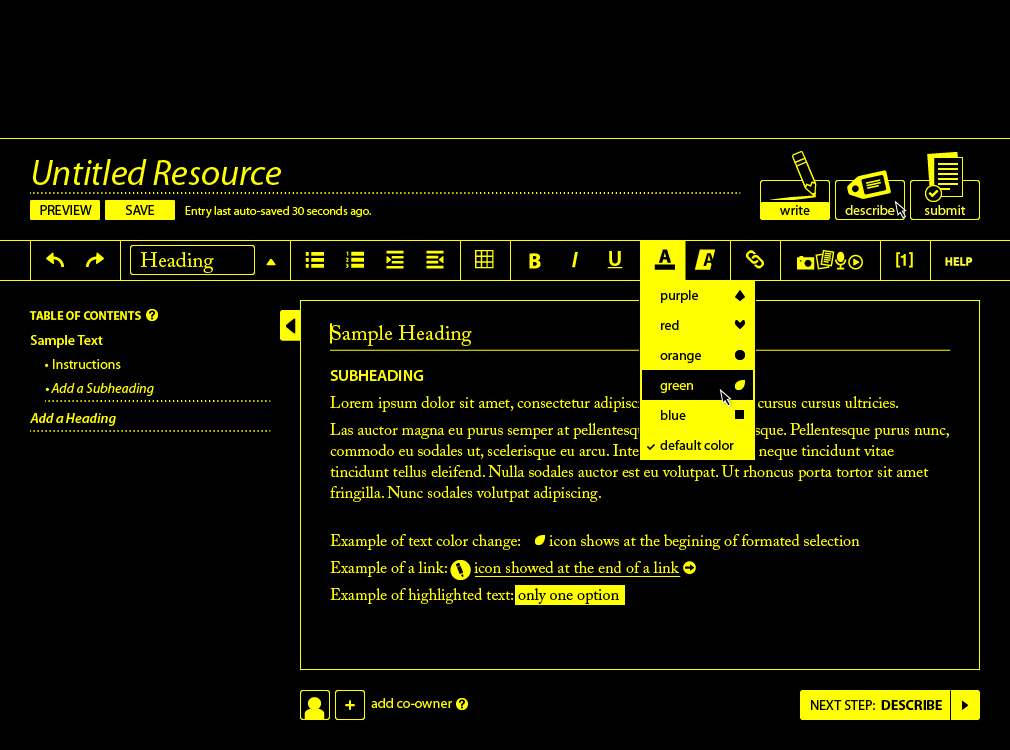
Figure 3: Floe/OER Commons authoring environment, publishing screen.
Figure 4: Floe/OER Commons authoring environment, editing screen in high contrast
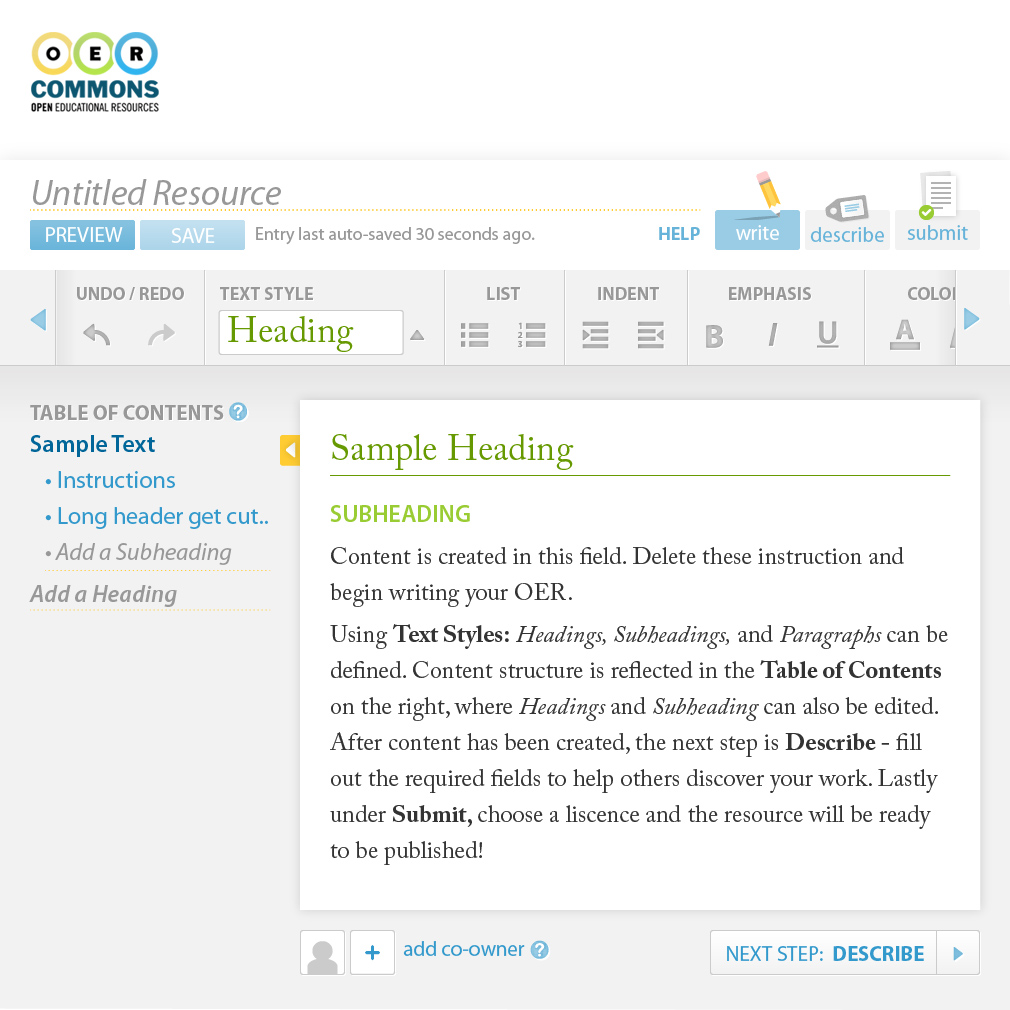
Figure 5: Floe/OER Commons authoring environment, editing screen with enlarged interface elements
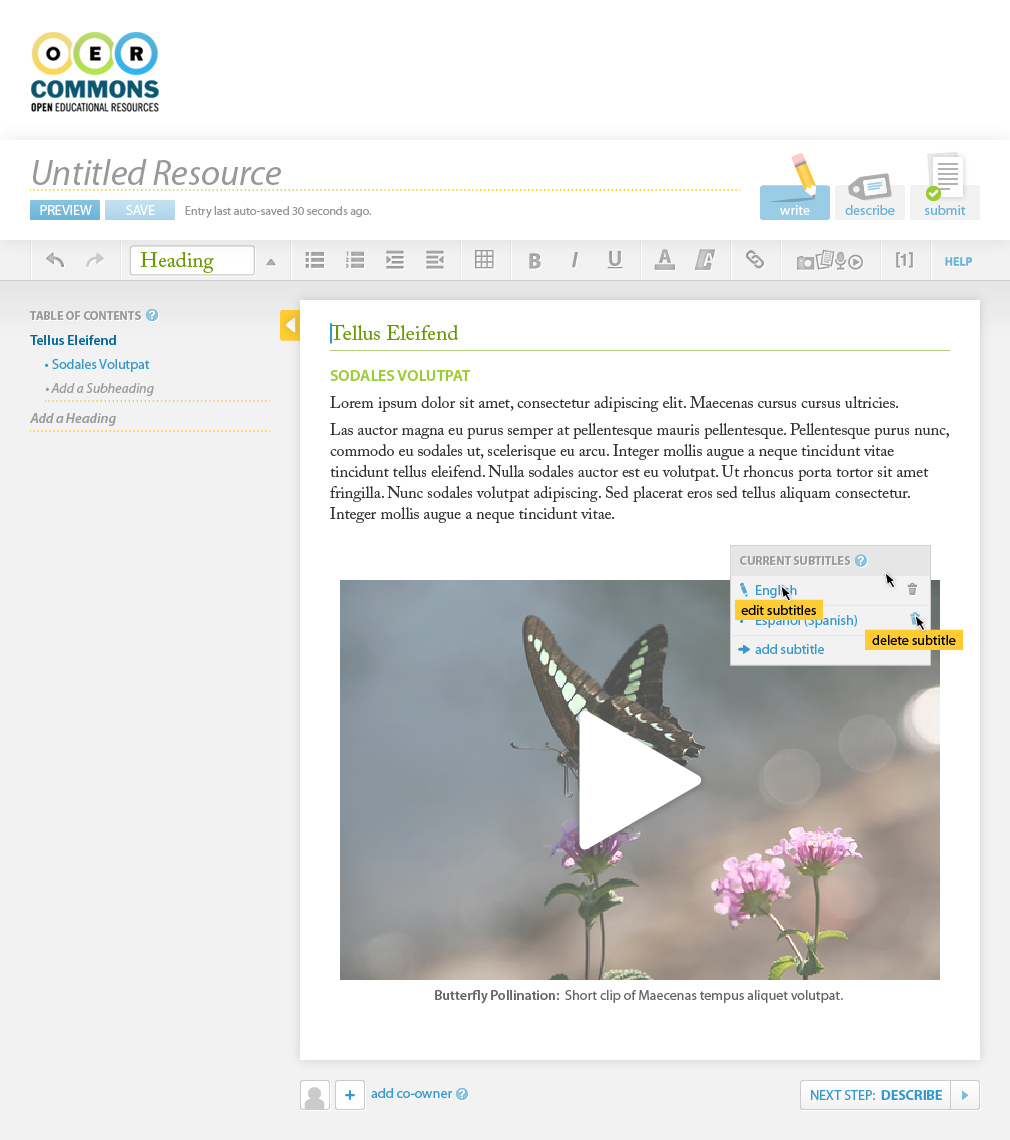
Figure 6: Floe/OER Commons authoring environment, video media inserted
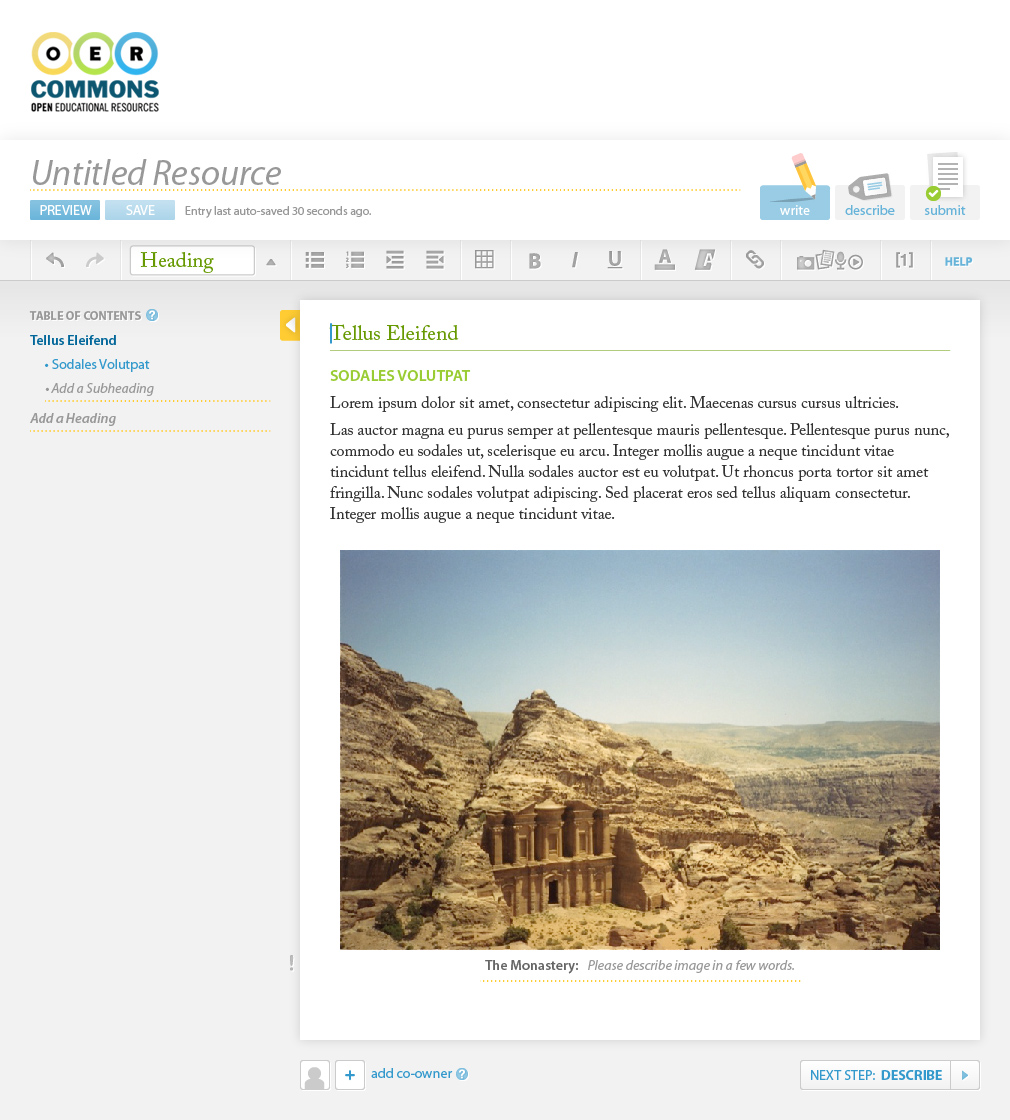
Figure 7: Floe/OER Commons authoring environment, image media inserted
Case Study 2: Floe Chart Authoring Tool
The Challenge
Charts and graphs are highly visual representations of information, thus, they are often accessible only to individuals who can perceive and process information visually. Users/learners who rely on other modalities for accessing, understanding and using data representations often experience difficulty accessing chart information. Many of these charts and graphs are created by authoring tools or proprietary design software that do not support the creation of accessible outputs. As a result, the exported charts and graphs are flat images that are not accessible by screen readers and scanning software, and it is not possible to navigate their content using a keyboard. One solution that is often used to mitigate the inaccessibility of these visual tools is the addition of descriptive text or information tables along with each chart or graph. However, listening to descriptive text or tabular data does not provide the same rich experience as the visual expression of a chart or graph.
The Floe Chart Authoring Tool
To address this challenge, the IDRC research team has focused on building a customizable chart authoring tool interface that will enable educational resource authors to create accessible, multi-modal charts/graphs and embed the output in their desired content. This project is ongoing and consists of several phases. This case study focuses on one aspect of the project: the authoring of an accessible and multi-modal pie chart. By starting with a fairly simple data set the research team wanted to set a foundation for future chart authoring work.
At the time of writing this case study, the authoring tool can produce pie charts with two different types of sonifications and generated from data entered by chart creators. The charts are built entirely in open-source web technologies including Javascript and the browser speech and audio APIs. The IDRC research team expects to continue development to accommodate different styles of charts and different sonification approaches, along with the export, sharing and remixing of sonified charts in a web context.
To access the latest demo of the Floe chart authoring tool please select this link.
The Floe Chart Authoring Tool Interface
This authoring interface consists of 4 main sections, two of which are editable. The first section includes two editable text fields - one for entering the chart title and one for a brief description. The second section contains an editable table of values from which the pie chart is generated. It allows user entry of segment text labels and their corresponding values. The third section contains both the visual and sonified versions of the pie chart that are generated from the information entered in the table. Each segment of the pie is presented with a different colour, a text label showing its percentage value, and an audio representation. The final section is an audio/visual legend that describes what each segment of the pie represents. In the legend, each segment colour is shown along with its corresponding text label and value in percent.
At the code level, the tool makes use of open source libraries including the Fluid Project’s Infusion, the Infusion-based Flocking audio synthesis library, and the D3 data visualization library. By using only open-source libraries and inherent advanced functionality of modern browsers such as speech and audio synthesis, the tool’s architecture models the same principles of openness embodied by OERs. The code is transparent, modular, modifiable and extensible.
Default State
A default pie chart is generated when the author first opens the tool interface, as seen in figure 8. This default pie chart will allow authors to discover the editable elements of the interface, enable them to experiment with the default pie chart sonification, and provide a preview of what the final pie chart will sound and look like.
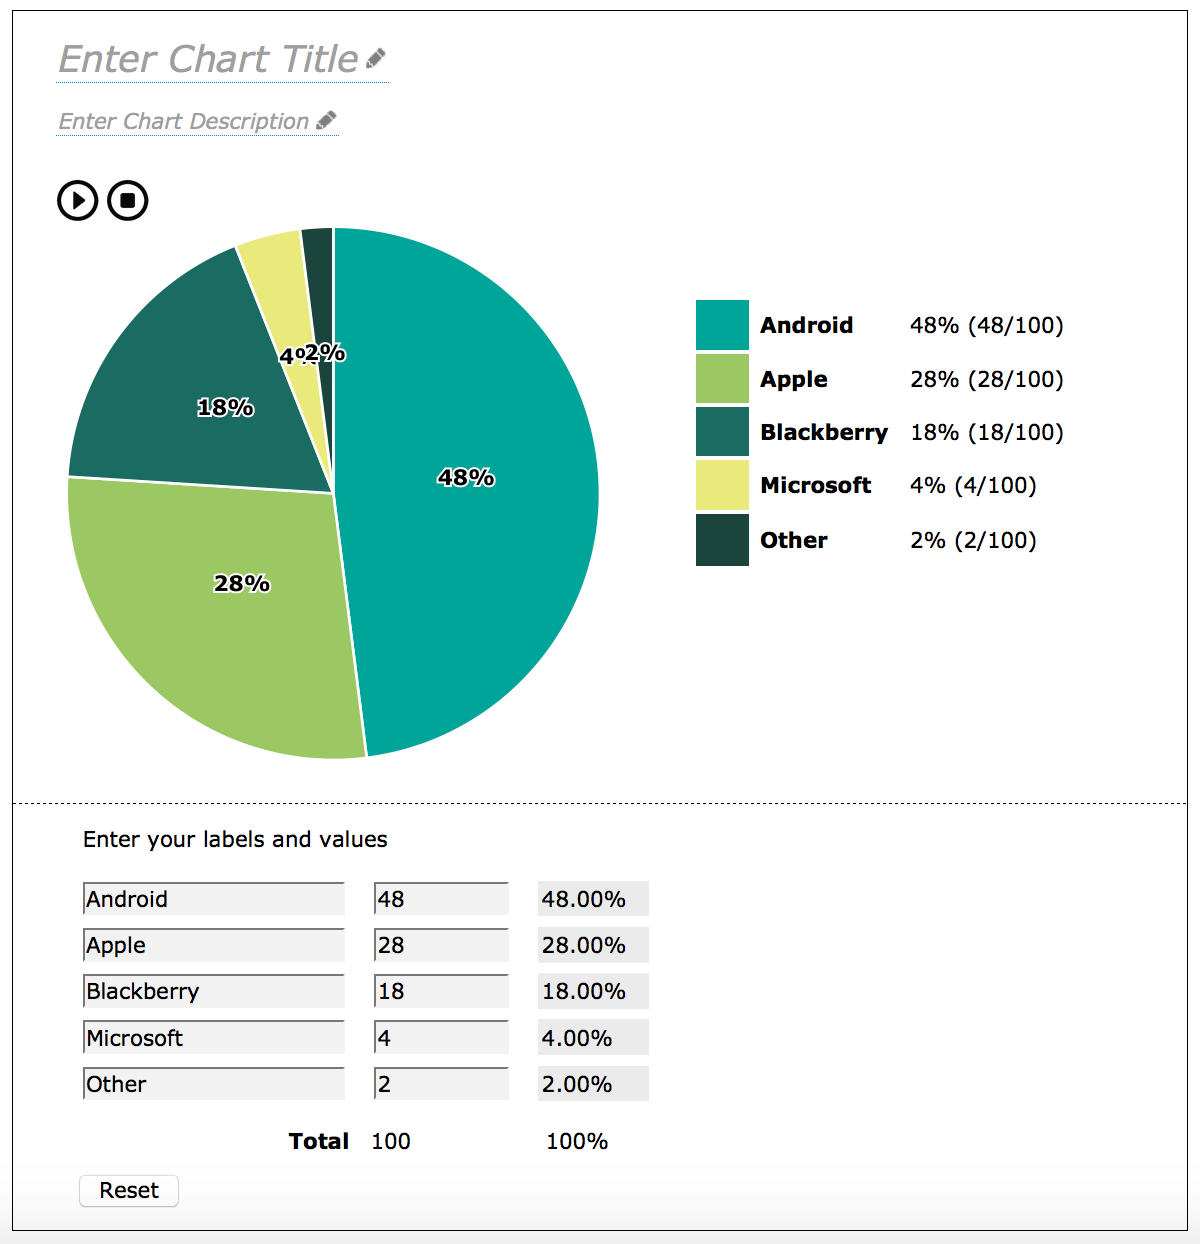
Figure 8: A default pie chart is created when the user first opens the Chart Authoring Tool interface.
User Interaction
The Floe chart authoring environment is compatible with screen readers and can be navigated and interacted with by mouse, keyboard or other input devices.
As the author enters (or edits, or deletes) text labels in the table, they are immediately updated in the legend. As the author enters (or edits, or deletes) numerical values in the table, the total value and corresponding percentages are calculated and updated in both the table and the legend.
While the chart sonification plays, a black stroke appears around the corresponding pie segment as well as around the visual legend item, in order to show the connection between the audio and visual versions of the pie (shown in figure 9).

Figure 9: The chart sonification plays and a black border appears around the relevant segments in the pie chart and legend.
As shown in figure 10, selecting the reset button will erase all the information including the chart title and description as well as the data entered in the table.
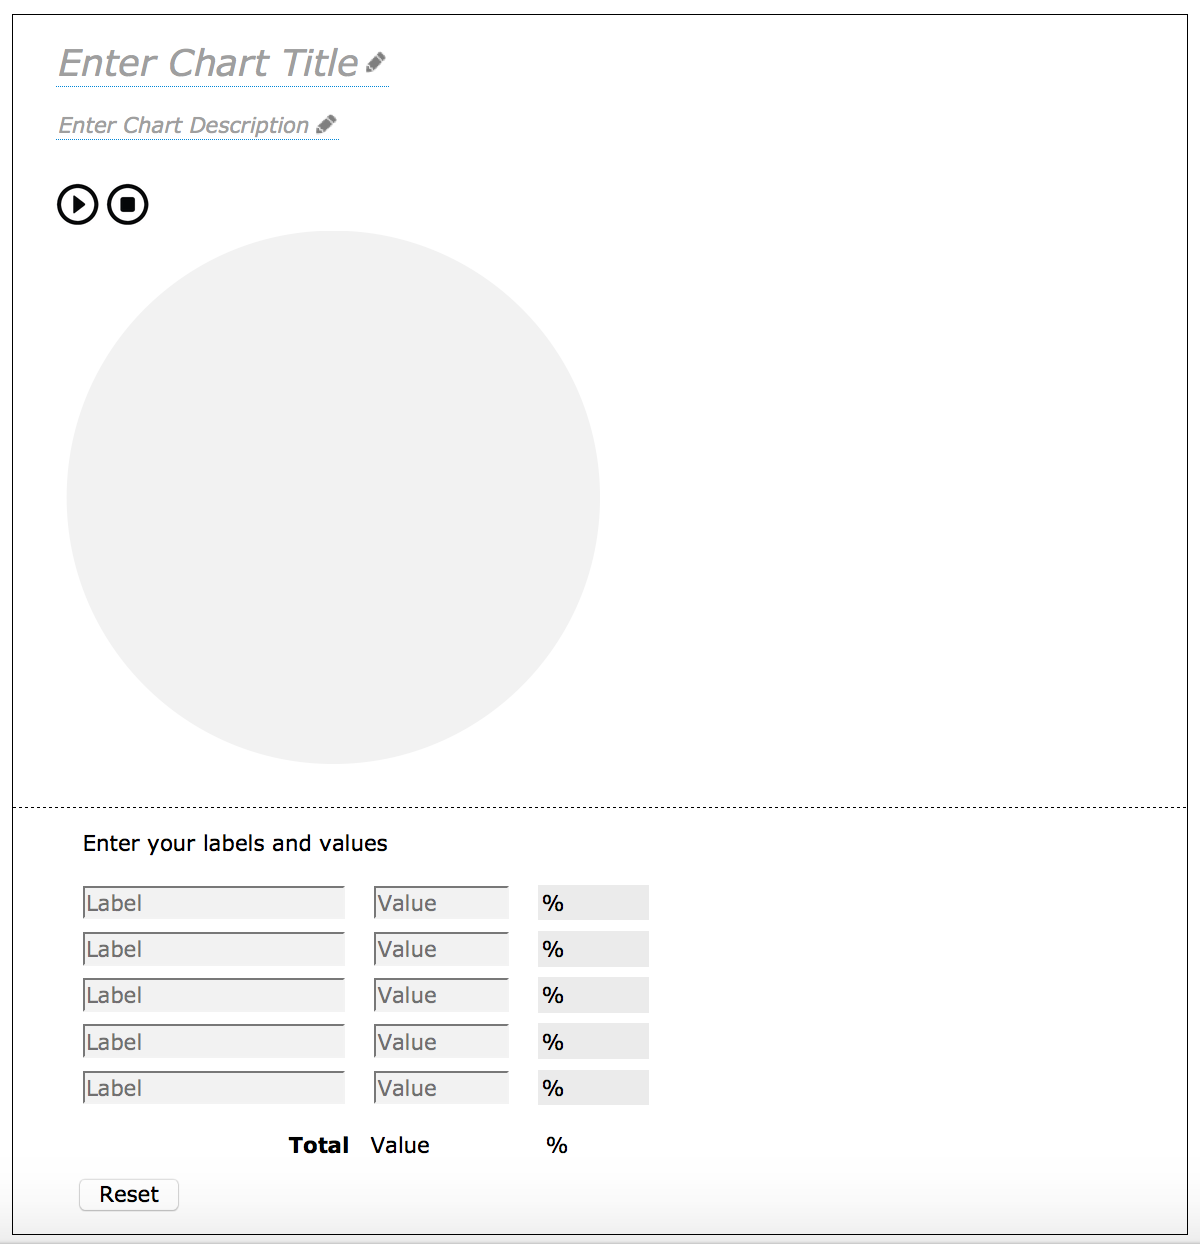
Figure 10: When the Chart Authoring Tool is reset, all information and data is erased.
The Long-Term Vision
- Integration of the User Interface Options (UIO) panel with the Floe chart authoring tool. This will give chart authors the ability to customize their authoring environment based on their unique needs and preferences.
- Ample end-user configurability for sonifications as well as visual representations. In this way the authoring tool will itself produce artifacts that can be further modified or re-authored by the audience. So far, user testing validates our sense that for sonification to be useful it must accommodate a diverse range of end-user tastes and preferences, and that what works best for one user may not for another.
Accessible Office Documents
The Accessible Digital Office Document (ADOD) Project offers guidance and techniques on how to author accessible documents using common office applications.
Comparisons of Authoring Environments
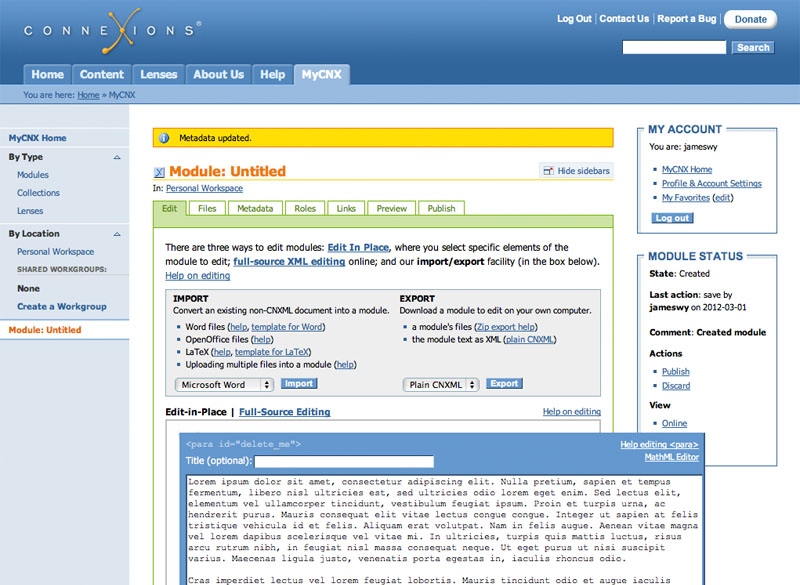
Figure 11: cnx.org OER authoring environment
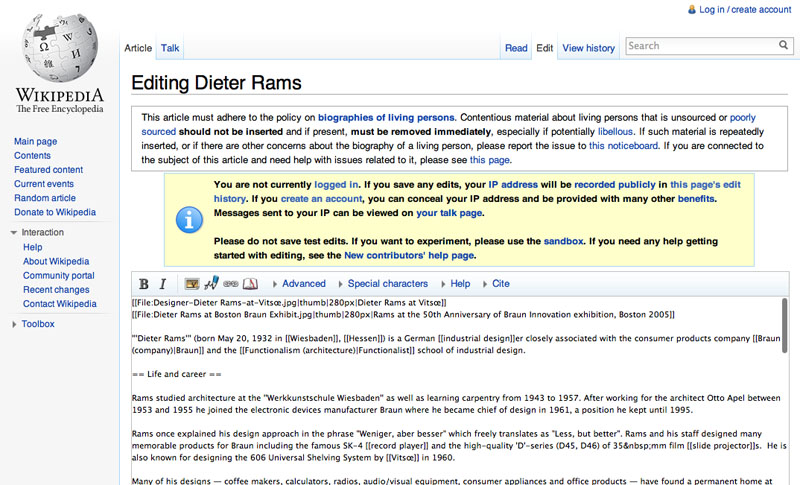
Figure 12: MediaWiki authoring environment.
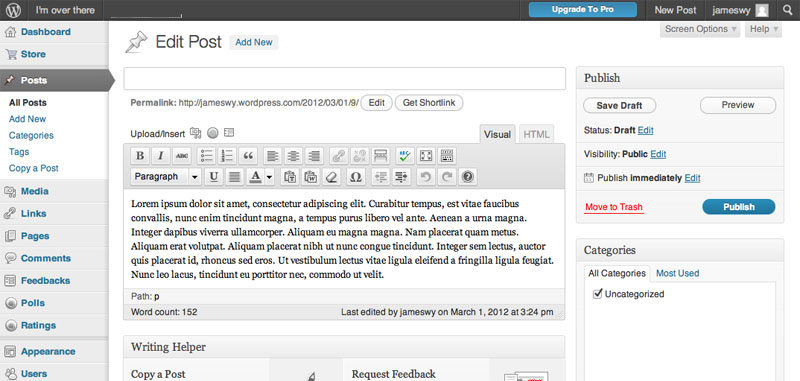
Figure 13: Wordpress authoring environment.
ISKME: More images of the OER Commons authoring environment are available at OER Commons authoring tool high fidelity mockups
UI Options: (Floe) UI Options Design Mockups